
Candlestick patterns are a powerful tool in the world of stock trading. They provide visual insights into market sentiment, helping traders make informed decisions.
Levelfields offers an excellent platform with advanced charting tools to help traders analyze candlestick patterns in real-time, enabling them to make more accurate market predictions.
With a bit of knowledge and practice, these patterns can become a crucial component of your trading strategy.
What Are Candlestick Patterns?
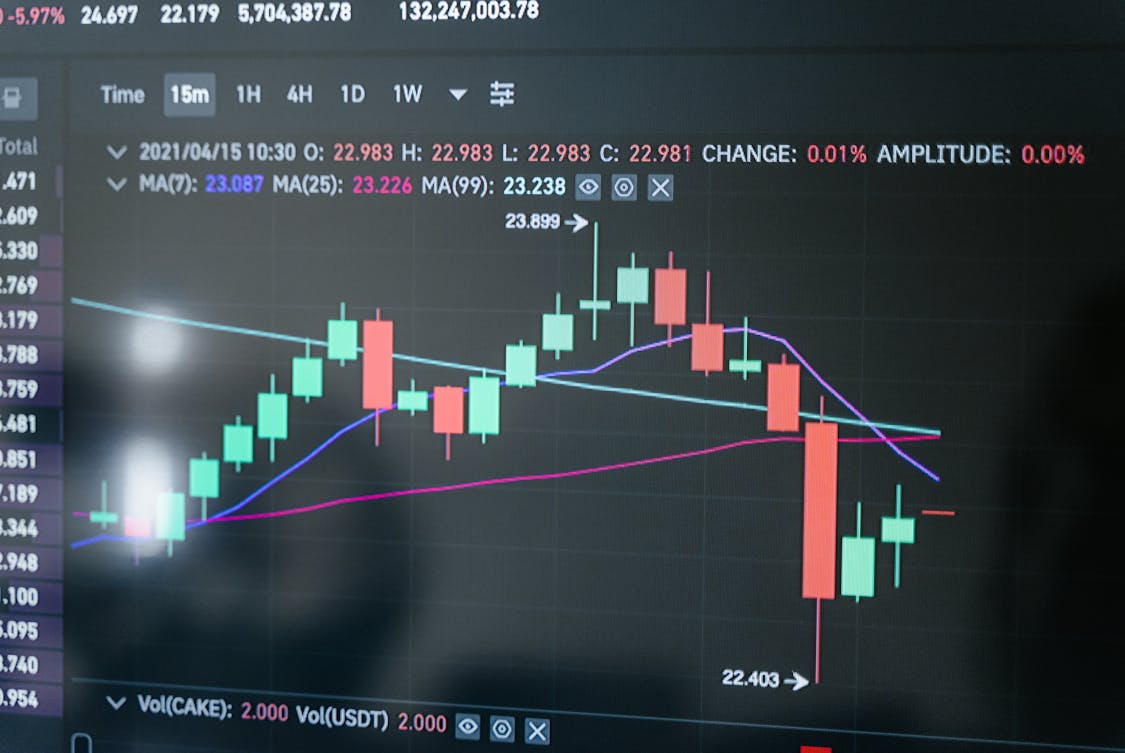
Candlestick patterns are graphical representations of price movements over a specific period.
Each candlestick consists of a body and wicks, which illustrate the open, close, high, and low prices.
The body shows the opening and closing prices, while the wicks indicate the highest and lowest points reached during that time frame.
These patterns form the basis of technical analysis. Traders use them to gauge market sentiment and predict future price movements.
Understanding the psychology behind these patterns is essential for building a successful trading strategy.
The Basics of Reading Candlesticks

To read candlesticks effectively, one must grasp the color and shape of each candle.
A bullish candlestick, typically green, indicates that the closing price is higher than the opening price.
Conversely, a bearish candlestick, often red, shows that the closing price is lower than the opening price.
The length of the body and the wicks also convey important information.
A long body with short wicks suggests strong buying or selling pressure, while a small body with long wicks indicates indecision in the market.
Recognizing these nuances sets the stage for more advanced analysis.
Key Candlestick Patterns to Know
Several candlestick patterns are widely recognized among traders. Learning these patterns can enhance your ability to read market signals.
Doji
A Doji forms when the opening and closing prices are virtually the same, resulting in a very small body.
This pattern indicates indecision among traders and could signal a reversal in the current trend. It’s essential to consider the preceding candles to gauge its implication properly.
Hammer
The Hammer pattern appears after a downtrend and features a small body with a long lower wick.
This candlestick suggests that buyers are stepping in after sellers have pushed the price down. It can be a strong indicator of a potential reversal.
Engulfing Pattern
The Engulfing pattern consists of two candles. A bullish engulfing occurs when a small bearish candle is followed by a larger bullish candle that completely engulfs it.
This pattern signals a reversal from a bearish trend to a bullish one. The bearish engulfing works in the opposite direction, indicating a potential downturn.
Morning Star and Evening Star
The Morning Star is a three-candle pattern that signals a bullish reversal.
It starts with a bearish candle, followed by a small-bodied candle, and concludes with a bullish candle that closes above the midpoint of the first candle.
The Evening Star, conversely, predicts a bearish reversal and follows a similar structure.
Combining Candlestick Patterns with Other Indicators
While candlestick patterns provide valuable insights, they become even more powerful when combined with other technical indicators.
For instance, using moving averages can help confirm trends identified by candlesticks.
If a bullish candlestick appears alongside a moving average crossover, it strengthens the buy signal.
Support and Resistance Levels
Support and resistance levels are critical in stock trading. They represent price points where stocks tend to reverse direction.
By identifying these levels, traders can use candlestick patterns to anticipate breakouts or reversals.
For example, a hammer near a support level may indicate a buying opportunity, while a bearish engulfing pattern at resistance could signal a time to sell.
Volume Analysis
Incorporating volume analysis can provide additional context to candlestick patterns.
A significant increase in volume during a bullish engulfing pattern suggests strong buying interest, enhancing the reliability of the signal.
Low volume during a reversal pattern may indicate weak conviction and warrant caution.
Timeframes and Candlestick Patterns
Different timeframes yield various insights when it comes to candlestick patterns. A candlestick on a daily chart may provide a different perspective than one on a weekly chart.
Short-term traders often rely on shorter timeframes, such as 15-minute or hourly charts, to capture quick price movements.
Longer timeframes can offer a broader view, helping to identify major trends.
It’s essential to align your trading style with the appropriate timeframe.
Day traders might focus on patterns that form within minutes, while long-term investors might prioritize daily or weekly patterns.
Understanding the timeframe can significantly influence your trading strategy.
Risk Management and Candlestick Patterns
Using candlestick patterns effectively requires a solid risk management strategy.
No pattern is foolproof, and losses can occur. It’s vital to set stop-loss orders to protect your capital.
A common approach is to place a stop-loss just below the low of a bullish pattern or above the high of a bearish pattern.
Position sizing is another critical aspect of risk management.
Determining how much to invest in a trade based on your overall portfolio and risk tolerance can make all the difference.
This discipline helps avoid devastating losses and keeps emotions in check during market fluctuations.
The Role of Psychology in Trading
Understanding market psychology is paramount when utilizing candlestick patterns. Traders often react emotionally, leading to impulsive decisions.
Recognizing the psychological factors at play can help you stay disciplined and adhere to your trading plan.
FOMO, or the fear of missing out, can lead traders to buy at the top of a market rally. Conversely, fear of loss can result in selling too soon.
Candlestick patterns can help mitigate these emotional responses by providing a more objective framework for decision-making.
Practicing with Candlestick Patterns
The best way to become proficient with candlestick patterns is through practice. Start by analyzing historical price charts and identifying patterns.
Many trading platforms offer demo accounts where you can trade with virtual money, allowing you to test your skills without financial risk.
Consider keeping a trading journal to record your observations and outcomes.
Documenting your trades and the candlestick patterns that influenced your decisions can provide valuable feedback for future improvement.
Resources for Learning More
Books, online courses, and webinars can deepen your understanding of candlestick patterns.
Consider exploring reputable trading websites and forums to connect with other traders.
Engaging with a community can provide additional insights and perspectives that enhance your learning experience.
Many platforms also offer charting tools that display candlestick patterns, making it easier to spot them in real-time.
Familiarizing yourself with these tools can streamline your trading process and improve your overall effectiveness.
By embracing candlestick patterns and integrating them into a well-rounded trading strategy, you can position yourself for success in the stock market.
The journey may come with ups and downs, but gaining a solid grasp of these patterns is a step towards becoming a more informed and confident trader.